Case study · Client project
metalRef
London Metal Exchange data, finally readable at a glance — a custom, mobile-first tool for a metals trader.
Drag to tilt · scroll the screen to explore
The problem
Market portals bury the signal in noise.
Existing platforms drown a trader in dense spreadsheets full of data they don't need — endless columns, cluttered tables, and no sense of how reliable each number is. The information is all there; it's just unusable in the moment a decision has to be made.
The approach
Strip it back to what a trader actually needs.
Only what matters
I distilled the trader's real decisions into a focused dashboard — cutting the noise of generic portals down to the few metrics they actually use.
Data you can trust
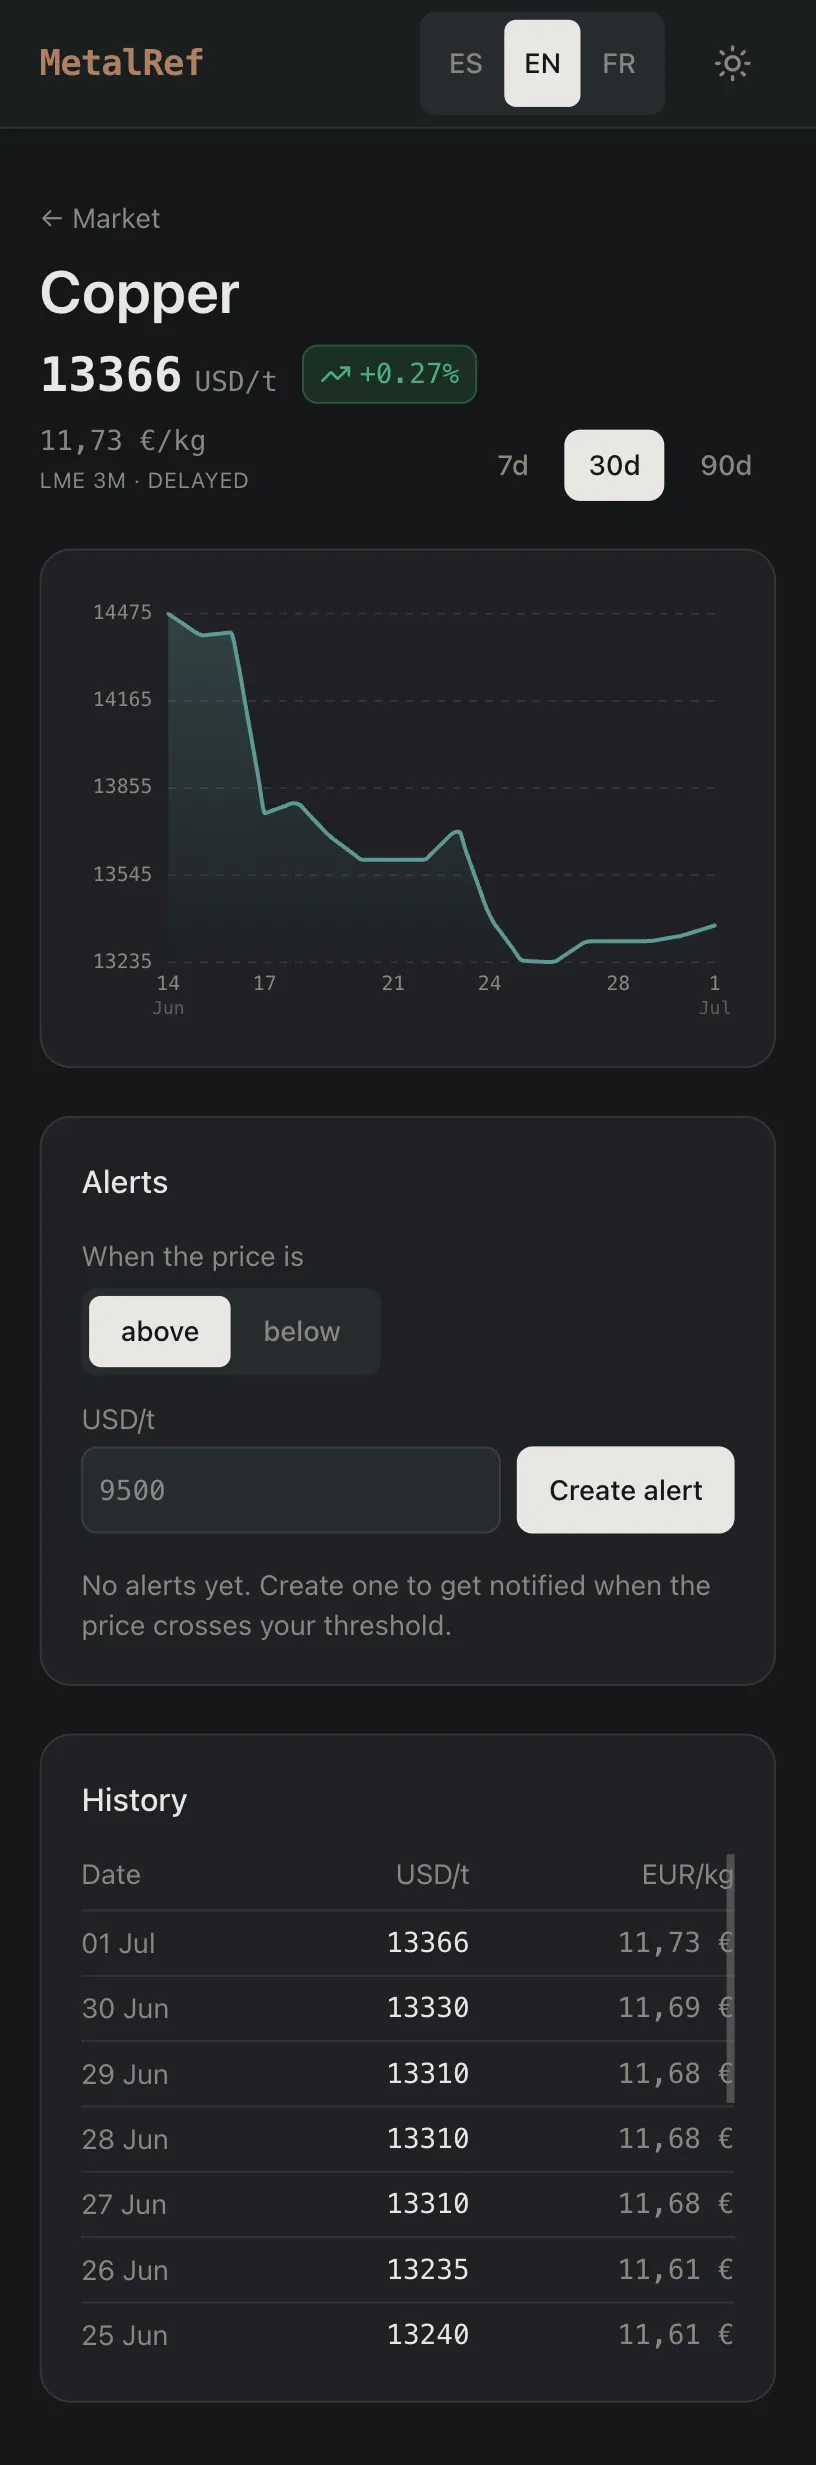
Every figure carries its provenance — source, delay and last-updated time — so the user always knows how fresh and reliable a number is.
Readable at a glance
Time-series charts with range selectors (7d / 30d / 90d) and dual-unit display (USD/t · €/kg) — all custom-built in SVG, no charting library.
Where it's at
A clear, trustworthy read on the market.
Mobile-first and dark-first, in three languages. Currently in MVP phase while the production data-provider integrations are finalised — the interface patterns (provenance, empty states, inspection, charts) are the part I set out to solve, and they're live.